
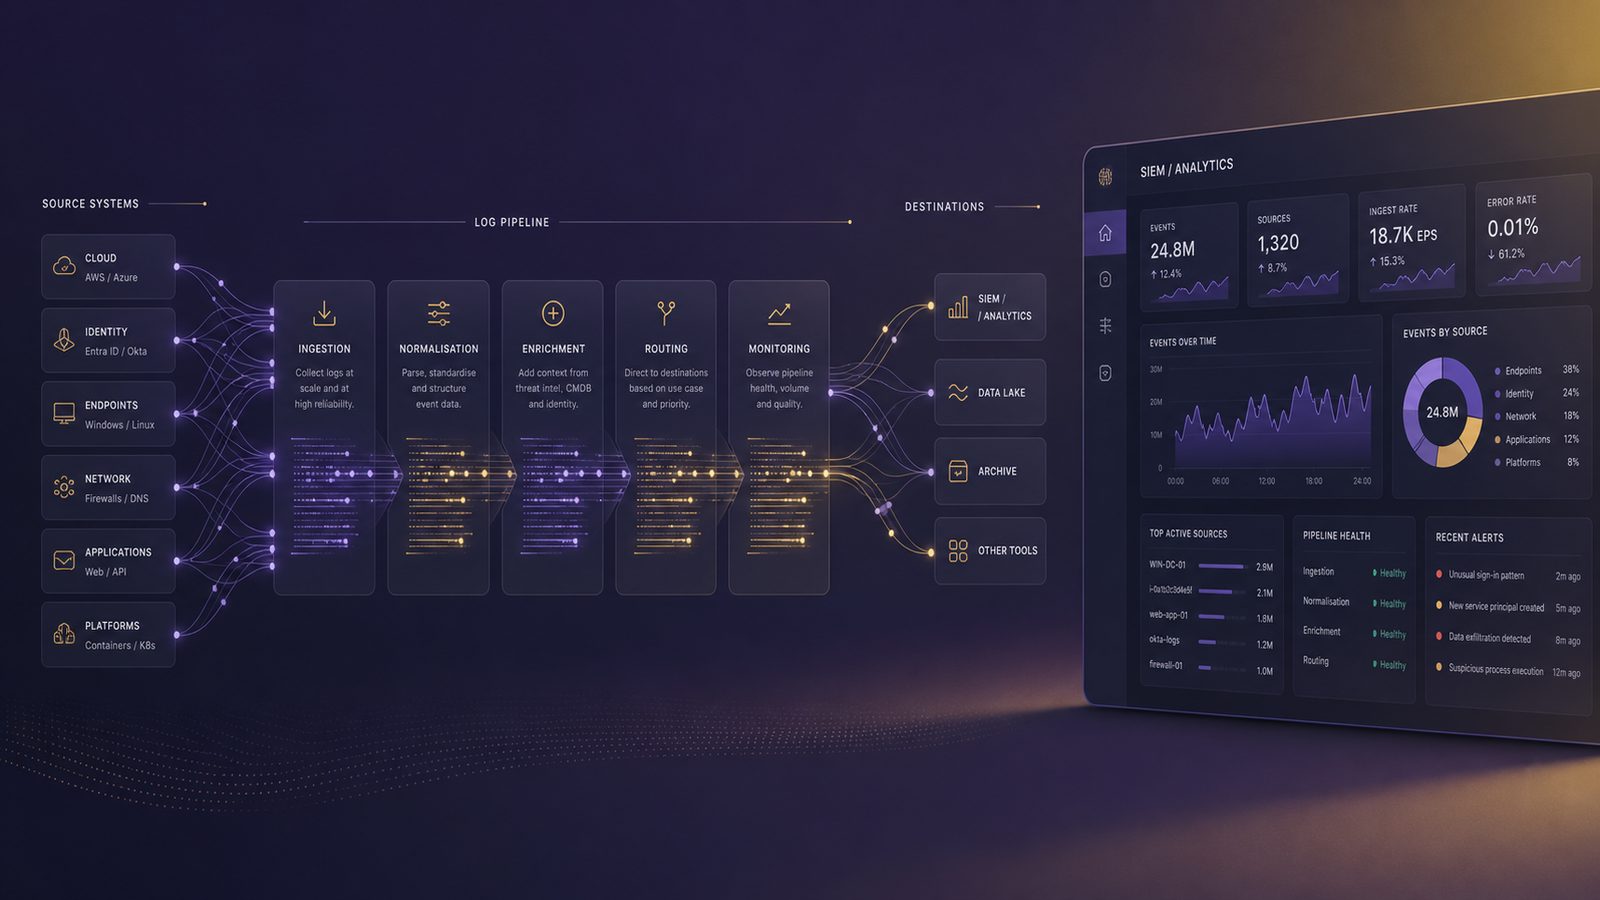
Detection engineering only works when the underlying log pipeline is designed to support it. If telemetry arrives late, is parsed inconsistently, or is dropped before it reaches your analytics layer, even well-written detections will miss activity or generate avoidable noise. For UK SMEs, the goal is not to collect everything. It is to build a pipeline that reliably delivers the right data, in the right shape, with enough context to support investigation and tuning.
A log pipeline is the path from source system to detection logic. In practice, that means collection, transport, parsing, normalisation, enrichment, routing, storage, and quality control. A SIEM is often one consumer of that pipeline, but it is not the same thing. If you are already thinking about how detections are written, it is worth pairing this article with our guidance on building a detection-as-code pipeline with Sigma and CI/CD and measuring detection coverage against MITRE ATT&CK using DeTT&CT, because both depend on trustworthy telemetry.
Key takeaways
- Start with the detections you need, then work backwards to the telemetry, schema, enrichment, and retention required to support them.
- Normalise fields consistently, keep raw events available, and treat parser quality as a security control rather than a housekeeping task.
- Design for reliability with buffering, backpressure handling, and explicit monitoring for source freshness and ingestion latency.
- Route data by use case and sensitivity so that high-value telemetry stays queryable without driving unnecessary storage cost.
- Secure the pipeline itself with least privilege, TLS, protected secrets, and change control over collectors, parsers, and routing.
What a detection engineering log pipeline needs to do
At a minimum, the pipeline must ingest events from multiple sources, preserve enough fidelity for investigation, and present them in a schema that detection content can query consistently. That sounds straightforward, but the design choices matter. A pipeline that is optimised only for storage cost will usually sacrifice context. A pipeline that is optimised only for raw fidelity can become expensive, difficult to query, and operationally fragile.
For detection engineering, the pipeline should do four things well. First, it should ingest data with predictable latency. Second, it should normalise fields so that the same concept, such as user, host, process, or source IP, is represented consistently. Third, it should enrich events with useful context, such as asset criticality or identity attributes, without overwriting the original event. Fourth, it should route data according to use case, sensitivity, and retention need.
That combination gives you a practical balance between detection quality and cost. It also makes it easier to tune rules, compare activity across sources, and investigate alerts without constantly jumping between tools.
Start with detection use cases, not log volume
Many logging projects begin with the wrong question: how much data can we collect? A better starting point is: what do we need to detect, and what telemetry proves or disproves those behaviours? That approach keeps the pipeline aligned to threat scenarios rather than abstract storage targets.
Map your priority threats to the telemetry required for each one. For example, if you care about credential theft, you may need authentication logs, directory service events, endpoint process creation, and privileged group changes. If you care about suspicious cloud access, you may need identity sign-in logs, audit logs, and application access events. If you care about lateral movement, you may need endpoint, network, and directory telemetry together.
This is where MITRE ATT&CK is useful. It helps you define the behaviours you want to observe, then work backwards to the event types and fields required to support those detections. The result is a minimum viable telemetry set for each detection family, rather than a generic wish list.
For SMEs, that minimum viable set is usually enough to start. You can expand later if a detection gap appears or if a new business risk emerges. The important point is to avoid collecting low-value logs simply because they are available.
Choose the right log sources and collection points
Most environments need coverage across endpoints, identity, cloud services, network devices, and key applications. The exact mix depends on your stack, but the principle is the same. You want the sources that best represent attacker behaviour, privilege use, and data access.
Endpoints provide process creation, script execution, service changes, persistence artefacts, and local security events. Identity platforms provide sign-in patterns, MFA outcomes, role changes, and directory actions. Cloud platforms provide control plane activity, storage access, and configuration changes. Network sensors can add visibility into command-and-control traffic, unusual egress, and segmentation failures. Applications often provide the business context that tells you whether an action was expected.
Collection method matters as much as source selection. Agent-based collection is often best for endpoint telemetry because it can capture richer local detail and survive some network interruptions. API-based collection is common for cloud and SaaS platforms, where the provider exposes audit and activity logs. Native platform forwarding, such as syslog or event forwarding, can be useful for infrastructure devices and servers, but it needs careful handling to avoid loss or format drift.
There is usually a trade-off between fidelity and operational simplicity. Agent-based approaches can be more detailed but require lifecycle management. API-based approaches are easier to deploy but may have rate limits, delayed availability, or incomplete fields. The right answer is usually a mix, chosen per source rather than per vendor preference.
Design the ingestion layer for reliability
The ingestion layer is where many pipelines fail quietly. Bursty sources, intermittent connectivity, and downstream backpressure can all cause drops if the design assumes every event will arrive smoothly. In practice, logging is spiky. Patch windows, failed logon storms, and incident activity can all create sudden increases in volume.
Use buffering between collection and storage so that short outages do not become data loss. That buffer might be a message queue, a log forwarder with disk spooling, or a managed ingestion service with retry logic. The key requirement is that the collector should not block or discard events simply because the destination is slow.
Backpressure needs explicit handling. If the downstream platform is overloaded, the pipeline should degrade predictably. That may mean prioritising high-value sources, reducing enrichment depth temporarily, or shedding low-value telemetry first. It should not mean random loss across the estate.
For remote sites or mobile endpoints, intermittent connectivity is normal. Design for store-and-forward behaviour, and make sure the collector can resume without duplicating large batches unnecessarily. If you are using cloud-native services, check how they handle retries, dead-letter queues, and ingestion quotas before you depend on them for security telemetry.
Normalise data into a detection-friendly schema
Detection engineering becomes much easier when event fields are consistent. Normalisation is the process of mapping source-specific fields into a common schema so that queries and correlation logic do not need to be rewritten for every platform. Common schemas include Elastic Common Schema, although vendors often provide their own equivalents.
The practical goal is not schema purity. It is query consistency. A detection should be able to look for a process name, a parent process, a user, a host, and a source address without knowing the quirks of each source format. If one platform uses user.name and another uses AccountName, the pipeline should resolve that difference before the event reaches the detection layer.
Parsing should be deterministic and version controlled. If a parser changes, detections can break without any obvious platform error. Keep field mappings documented, and test them against representative samples from each source. Timestamp consistency is especially important. Normalise to UTC as early as possible, preserve the original time where useful, and make sure clock drift is visible rather than hidden.
Where possible, keep the raw event alongside the normalised version. Raw data is valuable for investigations, parser debugging, and future enrichment. Normalised data is what your detections query. You need both.
Enrich events without breaking fidelity
Enrichment adds context that makes detections more useful. Typical examples include asset ownership, device criticality, user department, geolocation, threat intelligence, and vulnerability status. Used well, enrichment helps you prioritise alerts and reduce false positives. Used badly, it can overwrite original values, introduce stale context, or make the pipeline harder to trust.
Enrichment should be additive. Do not replace source fields with derived values. Instead, append context in separate fields so that the original event remains intact. That matters when you need to explain why a detection fired or when you later discover that an enrichment source was wrong.
Decide where each enrichment step belongs. Some enrichment is best done at ingestion, such as asset inventory lookups or identity metadata. Some is better done in the analytics layer, where detections can join against reference data on demand. Threat intelligence enrichment should be used carefully, because over-enrichment can create brittle rules and unnecessary noise. If you want a broader view of how telemetry and network context fit together, our article on designing Integrated Network Detection and Response is a useful companion.
Be cautious with geo enrichment. It can help identify impossible travel or unusual access patterns, but it is not a strong signal on its own. Likewise, vulnerability enrichment is useful for prioritisation, but it should not be treated as proof of exploitation.
Route data by use case, sensitivity, and retention need
Not all telemetry has the same value or retention requirement. A sensible pipeline separates hot, warm, and cold storage patterns so that high-value data stays queryable, while lower-value data remains available for compliance, forensics, or periodic review.
Hot storage should contain the data most likely to support active detection and triage. That usually includes recent endpoint, identity, and cloud audit events. Warm storage can hold older data that is still useful for investigations and hunting, but not queried constantly. Cold storage is for long-term retention, legal hold, or slower retrospective analysis.
Routing should also reflect sensitivity. Some logs contain personal data, secrets, or operational details that should not be broadly accessible. Use role-based access control, separate workspaces or indexes where appropriate, and minimise who can query raw events. If you are already thinking about access design, the principles in designing least privilege access using IAM and RBAC apply directly to logging platforms as well.
For UK SMEs, cost control is often a driver here. High-volume sources such as verbose application logs or network telemetry can become expensive if everything is retained at premium query rates. Route only the data that supports a defined use case into expensive storage. Archive the rest in a cheaper tier if you still need it.
Build for detection engineering workflows
A good pipeline supports the way analysts actually work. That means it should make it easy to write Sigma rules, KQL queries, correlation logic, and hunting queries against a stable field set. It should also preserve enough raw context to explain why a detection fired and to tune the rule afterwards.
Correlation is where pipeline design becomes especially important. Multi-stage detections often depend on events from different sources arriving in the right order and with consistent identifiers. If hostnames, device IDs, and user principals are normalised differently across sources, correlation becomes unreliable. The same is true if timestamps are inconsistent or if one source drops fields that another source depends on.
Preserving raw events matters for investigation. Analysts often need to compare the parsed view with the original record to understand whether a detection was triggered by a genuine behaviour or a parsing artefact. If the raw event is discarded too early, tuning becomes slower and less accurate.
It is also worth designing the pipeline so that detections can be tested against historical data. Backfilling a new rule across a retained dataset is one of the quickest ways to understand whether the pipeline supports real detection work or only live alerting.
Control noise, duplication, and blind spots
Noise is not just an analyst problem. It is often a pipeline problem. Duplicate events, repeated retries, and over-verbose sources can all create false positives or hide the real signal. Suppression and deduplication should therefore be deliberate design choices, not ad hoc fixes in the SIEM.
Deduplication is useful when the same event can arrive through multiple paths or when a collector retries after a timeout. But be careful not to deduplicate away meaningful repetition. A burst of similar events may itself be the signal. Sampling is even more sensitive. It can reduce cost, but it can also remove the very events you need for detection. Use it only where the loss of fidelity is understood and accepted.
Blind spots are usually more dangerous than noise because they create false confidence. Common causes include missing connectors, parser failures, expired API tokens, and source systems that stop logging after a patch or configuration change. Build explicit checks for source freshness, event counts, and parser success rates so that a silent failure becomes visible quickly.
One practical approach is to compare expected versus observed volume by source. If a domain controller, cloud tenant, or critical server suddenly stops producing events, that should raise an operational alert even if no security rule has fired.
Secure the pipeline itself
Logging infrastructure is security infrastructure, which means it needs its own controls. If an attacker can tamper with logs, disable collectors, or steal connector credentials, they can reduce your ability to detect and investigate activity. That risk is often underestimated in smaller environments.
Protect access to the pipeline with least privilege. Separate administrative access from analyst access, and restrict who can change parsers, retention settings, or forwarding rules. Use strong authentication for management interfaces, and prefer short-lived credentials or managed identities where possible.
Integrity matters too. Transport should use TLS, and collectors should authenticate to destinations where the platform supports it. If logs traverse untrusted networks, mutual authentication is worth considering. For infrastructure that supports it, signing or hashing batches can help detect tampering in transit or at rest. Our article on designing secure communications using TLS and mutual authentication covers the transport side of that design.
Do not forget the secrets used by the pipeline itself. API keys, service principals, certificates, and forwarding tokens should be stored securely, rotated, and monitored. If a logging connector is compromised, it can become a useful pivot point into your wider environment.
Measure pipeline health and detection value
If you do not measure the pipeline, you will not know whether your detections are operating on complete and timely data. Useful health metrics include ingestion latency, drop rate, parse success rate, source freshness, duplicate rate, and the percentage of events enriched successfully.
Latency matters because delayed telemetry reduces the value of time-sensitive detections. Drop rate matters because missing events can create false negatives. Parse success matters because malformed records often become invisible unless you track them explicitly. Source freshness matters because a dead connector can look like a quiet environment.
Detection value metrics are just as important. Track how often a rule fires, how many alerts are closed as benign, how many are tuned or suppressed, and whether the underlying data source actually supports the intended behaviour. If a detection never fires, that may mean the threat is absent, but it may also mean the pipeline is missing the necessary fields.
Feedback from incidents should feed back into the pipeline. If analysts repeatedly ask for a field that is missing, add it. If a source produces too much low-value noise, adjust collection or routing. This is the continuous improvement loop that keeps detection engineering practical rather than theoretical.
A practical reference architecture for UK SMEs
A sensible SME design is usually simpler than enterprise reference architectures, but it still needs clear separation of responsibilities. A common pattern is: source systems emit telemetry to collectors, collectors buffer and forward it to a central ingestion layer, the ingestion layer normalises and enriches events, and the analytics layer stores hot data for detection while archiving older data elsewhere.
For Microsoft-heavy environments, that might mean endpoint and identity logs flowing into a central platform such as Sentinel, with KQL used for analytics and hunting. For mixed environments, you may have a combination of cloud-native audit feeds, syslog collectors, and endpoint agents feeding a common normalisation layer before the SIEM. The exact tooling matters less than the design principles: reliable transport, consistent schema, preserved raw events, and measurable health.
Common mistakes include collecting too much too early, normalising only some sources, enriching in ways that destroy original context, and treating the SIEM as the whole pipeline. Another common issue is failing to plan for retention and cost from the start. If you know a source is high volume but low value for live detection, route it differently before it becomes a budget problem.
For teams that want to improve detection maturity over time, it can help to map pipeline capabilities to ATT&CK coverage and then use that mapping to prioritise new sources or parser work. That keeps investment tied to observable risk rather than platform features.
Implementation checklist
Before you move a pipeline into production, answer these questions:
- Which threat scenarios are we trying to detect, and which sources support them?
- Which fields must be normalised across all sources for correlation to work?
- Where will buffering happen if the destination is unavailable?
- Which events must be retained in raw form for investigation?
- What is the expected latency, and how will we measure it?
- How will we detect missing sources, parser failures, and token expiry?
- Who can change routing, retention, enrichment, or access controls?
- Which data belongs in hot, warm, or cold storage?
If you cannot answer those questions clearly, the pipeline is probably not ready for dependable detection engineering.
For many UK SMEs, the best next step is not a wholesale platform change. It is a focused review of telemetry priorities, parser quality, and operational controls around the existing stack. That usually delivers better detection value than adding more tools.
If you would like help reviewing your logging architecture, aligning telemetry to detection use cases, or tightening the operational controls around your SIEM and collectors, speak to a consultant.
Frequently asked questions
How is a log pipeline different from a SIEM?
A log pipeline covers the full path from source collection through transport, parsing, normalisation, enrichment, routing, and retention. A SIEM is usually one consumer of that pipeline, focused on correlation, alerting, and investigation.
What logs are most useful for detection engineering?
The most useful logs are the ones that support your priority threat scenarios. In most SME environments that means endpoint process and security events, identity and sign-in logs, cloud audit logs, and selected network or application telemetry where they add unique detection value.
Comments are closed