
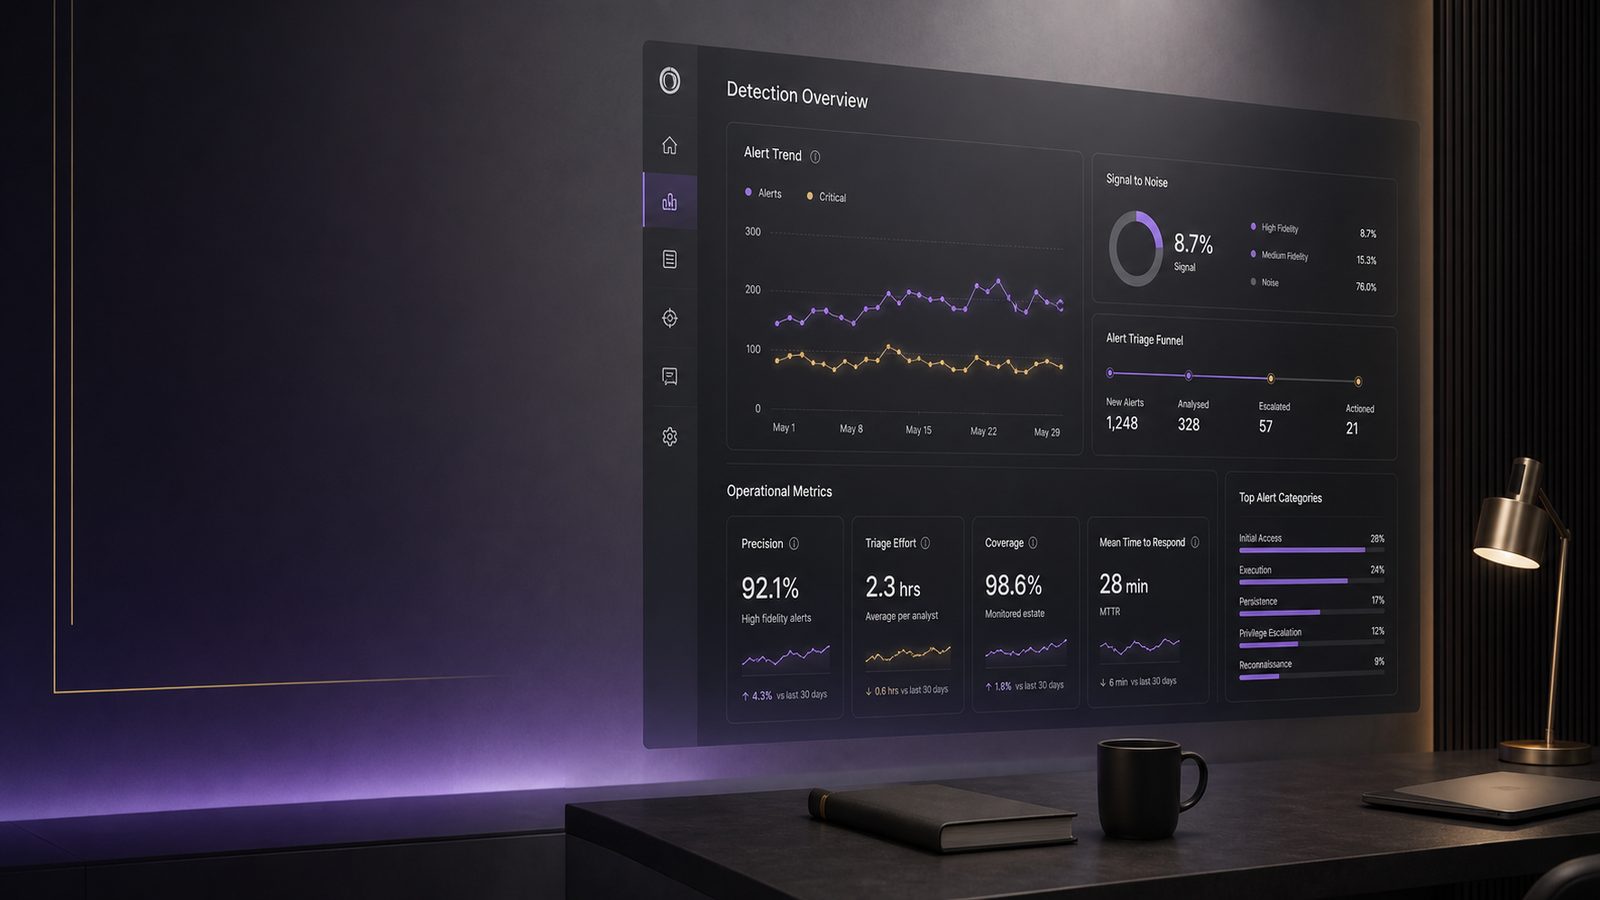
Measuring detection quality and false positives for technical teams
Security teams often talk about alert volume, but volume alone does not tell you whether your detections are useful. A rule that generates hundreds of alerts may be noisy, but a quiet rule can also be poor if it misses the activity you care about. For UK SMEs, the practical question is not whether a SIEM, XDR, or NDR platform produces alerts. It is whether those alerts help analysts find meaningful activity quickly enough to matter.
That is why detection quality needs to be measured, not assumed. If you do not measure it, you will usually end up tuning by instinct, suppressing alerts reactively, and underestimating the cost of false positives. You may also overestimate coverage because a rule exists, even if it rarely fires on the right behaviour.
Why detection quality needs to be measured, not assumed
Detection engineering is a trade-off between coverage, fidelity, and operational cost. A high-fidelity detection is one that is more likely to represent genuine malicious or suspicious activity. A low-fidelity detection may still be useful for hunting, but it will usually create more analyst work per useful outcome.
False positives are alerts that turn out not to represent the behaviour you wanted to detect. False negatives are the more serious blind spot: activity that should have been detected but was not. In practice, teams often focus on false positives because they are visible every day. The risk is that aggressive tuning removes the noise but also weakens the control.
Alert fatigue is the operational consequence. When analysts see too many low-value alerts, they spend more time dismissing noise and less time investigating meaningful events. Over time, this can increase mean time to triage, reduce confidence in the tooling, and create a habit of ignoring certain alert classes altogether.
For an SME, good detection quality means the security team can answer three questions with evidence:
- Which detections are producing useful investigations?
- Which detections are consuming analyst time without adding value?
- Where are the gaps in coverage for the threats that matter to the business?
How false positives, false negatives, and alert fatigue affect SOC capacity
False positives do not just waste time. They distort prioritisation. If a noisy rule sits above a genuinely important one in the queue, the team may spend its best attention on low-value work. In a small team, that can be enough to delay response to a real incident.
False negatives are harder to observe because they do not create tickets. You usually discover them through incident review, threat hunting, purple team exercises, or comparison against known attack techniques. That is why detection quality should be assessed across both alert outcomes and missed opportunities.
Defining what good looks like for your environment and use cases
There is no universal benchmark for a good detection. A rule that is excellent for a finance environment may be poor for a software business, and a rule that is useful on endpoints may be irrelevant in cloud identity logs. Start by defining the use case.
For each detection, document:
- The behaviour or technique it is intended to catch
- The data source it depends on
- The expected severity and response path
- The business assets or identities it should prioritise
- The acceptable level of noise
This makes later measurement much easier because you are comparing the alert stream against a stated purpose rather than an informal expectation.
Core metrics for detection engineering and SOC operations
The most useful metrics are the ones that help you decide whether to keep, tune, replace, or retire a detection. Counting total alerts is not enough. You need a mix of quality, efficiency, and coverage measures.
Precision, recall, alert volume, and mean time to triage
Precision tells you how many alerts are useful out of the total generated. In simple terms, if a rule fires 100 times and only 10 alerts lead to meaningful investigation, its precision is low. Recall tells you how much of the relevant activity the detection catches. A rule can have high precision but poor recall if it only catches a narrow subset of the behaviour.
Alert volume matters because it drives workload, but it should be interpreted alongside precision. Ten high-quality alerts may be more valuable than one hundred low-quality ones. Mean time to triage, or MTTT, shows how long it takes analysts to decide whether an alert is benign, suspicious, or malicious. If a detection is technically accurate but takes too long to assess, it still has operational cost.
Useful supporting metrics include:
- True positive rate by rule or use case
- False positive rate by rule or use case
- Time to close benign alerts
- Escalation rate to incident handling
- Percentage of alerts with sufficient context at first sight
Measuring fidelity by detection source, rule family, and ATT&CK technique
It helps to segment metrics by source and intent. Endpoint detections often behave differently from identity detections, and both differ from network detections. A broad rule family, such as suspicious PowerShell activity, may contain several sub-rules with very different precision.
Mapping detections to MITRE ATT&CK techniques gives you a common language for coverage analysis. It also helps you spot where you are over-investing in one technique while leaving another under-monitored. The point is not to chase full ATT&CK coverage for its own sake. The point is to understand where your detections are strong, weak, or noisy.
Building a practical evaluation framework
To measure detection quality properly, you need a repeatable evaluation process. That process does not need to be complex, but it should be consistent.
Using labelled alert samples, incident outcomes, and analyst feedback
Start with a sample of alerts from a defined period. Label each one based on the investigation outcome. Common labels include benign, expected administrative activity, suspicious but unconfirmed, and confirmed malicious. If your team already uses case management, those outcomes may already exist in tickets and notes.
Then compare the labels with the original detection intent. Ask whether the alert was:
- Correct and useful
- Correct but too noisy
- Incorrect because the logic was too broad
- Incorrect because the data source was incomplete
Analyst feedback is especially valuable. A detection may technically be a true positive, but if it lacks context, fires too late, or creates a poor investigation path, it may still be low quality in operational terms.
Separating noisy detections from genuinely useful signals
Not every noisy detection should be removed. Some detections are intentionally broad because they support hunting or early warning. The distinction is between acceptable noise and avoidable noise.
Acceptable noise is the alert volume you can tolerate because the detection still provides value. Avoidable noise is caused by poor scoping, missing exclusions, weak thresholds, or a lack of context. When reviewing detections, classify the noise source before changing the rule. That prevents over-tuning based on a single bad week of alerts.
How to reduce false positives without weakening coverage
Reducing false positives is usually about improving context rather than simply making the rule stricter. If you tighten thresholds too far, you may lose the very activity you wanted to see.
Tuning thresholds, exclusions, and suppression logic carefully
Thresholds are useful when the behaviour is naturally bursty, such as repeated failed logons or multiple process launches. But thresholds should be based on observed behaviour, not guesswork. Use a representative period of data and check whether the threshold excludes legitimate activity.
Exclusions can reduce noise, but they should be narrow and documented. A common mistake is to exclude entire hosts, users, or subnets because they are noisy today. That may hide future abuse if those assets are later compromised. Prefer scoped exclusions tied to specific processes, service accounts, management tools, or known maintenance windows.
Suppression logic can be effective when the same event repeatedly triggers the same investigation. For example, if a scheduled task or patching tool creates predictable alerts, suppressing duplicates for a short period may be better than disabling the rule. Keep suppression windows short and review them regularly.
Using asset context, identity context, and time-based baselines
Context improves fidelity. An alert on a domain controller, finance workstation, or privileged account should generally be treated differently from the same activity on a test system. Likewise, a login from a managed device during business hours may be less suspicious than the same action from an unmanaged device at an unusual time.
Identity context is especially important in cloud and hybrid environments. If your SIEM can enrich alerts with role, group membership, device compliance, and location, analysts can make quicker decisions. Time-based baselines help too. A detection that compares current behaviour with normal patterns can reduce noise, but it must be recalibrated when the business changes, such as after a merger, office move, or shift to remote working.
Detection quality by data source
Detection quality is constrained by the data you collect. Good logic cannot compensate for poor telemetry.
Comparing endpoint, identity, email, and network telemetry
Endpoint telemetry usually gives the richest detail for process creation, script execution, persistence, and lateral movement indicators. It is often the best source for high-confidence detections, provided coverage is broad enough and agents are healthy.
Identity telemetry is valuable for sign-in anomalies, privilege use, MFA fatigue patterns, and account abuse. It can be high signal, but it depends on good logging from identity providers and clear understanding of normal user behaviour.
Email telemetry is useful for phishing-related detections, but it can be noisy if the organisation receives large volumes of marketing or automated mail. Network telemetry can help spot command-and-control patterns or unusual egress, but encryption and NAT can reduce visibility. In many SMEs, network detections are best used as supporting evidence rather than the only signal.
Understanding where source quality limits detection performance
If a detection is noisy, check whether the problem is the rule or the source. Missing fields, inconsistent timestamps, duplicate events, and delayed ingestion can all make a good rule look bad. Before tuning logic, verify that the source is normalised and that the event schema is stable.
It is also worth checking whether the source has enough coverage. A detection that relies on one endpoint agent or one identity feed may look precise simply because it has limited visibility. That is not the same as good quality.
Operationalising feedback loops
Detection quality improves when feedback becomes part of normal operations rather than a one-off review exercise.
Analyst review, case management, and rule lifecycle management
Every alert should feed back into the detection lifecycle. Analysts should be able to record whether a rule needs tuning, enrichment, suppression, escalation, or retirement. Over time, that creates a useful history of why changes were made.
A simple lifecycle model works well:
- Create the detection with a clear use case
- Validate it against test data or known scenarios
- Monitor alert outcomes during an initial observation period
- Tune based on evidence
- Review periodically for drift, noise, and coverage gaps
If you use a SIEM, XDR, or SOAR platform, make sure rule changes are tracked like any other controlled change. That makes it easier to explain why a detection changed and whether the change improved quality.
Tracking changes over time in SIEM, XDR, or SOAR platforms
Detection quality is not static. Business changes, cloud migrations, new software, and staff turnover all affect the alert profile. A detection that worked well six months ago may now be noisy because the environment changed.
Track trends over time rather than relying on a single monthly snapshot. Useful trend views include alert volume by rule, precision by rule family, average triage time, and the proportion of alerts that lead to escalation. If a rule becomes noisier after a change, correlate that with configuration changes, new assets, or new user behaviour.
Reporting detection performance to stakeholders
Technical teams need to explain detection performance in a way that supports decisions. Stakeholders do not need every rule detail, but they do need to understand trade-offs.
Presenting trends, risk trade-offs, and coverage gaps clearly
When reporting upwards, avoid presenting raw alert counts in isolation. Instead, show whether the team is seeing more useful detections, less noise, or better coverage of priority techniques. A small set of well-chosen charts is usually enough:
- Top noisy detections by analyst time consumed
- Detections with the highest escalation rate
- Coverage gaps against priority ATT&CK techniques
- Changes in precision after tuning
This helps decision-makers understand where investment is needed. Sometimes the answer is better logging. Sometimes it is rule tuning. Sometimes it is a process change, such as better case handling or clearer ownership of alert review.
Using metrics to prioritise engineering work and investment
Metrics should drive action. If a detection has low precision and low business value, retire it. If it has high value but poor context, improve enrichment. If a source is unreliable, fix the pipeline before spending time on rule logic. If a technique is important but uncovered, build a new detection or add a complementary source.
For UK SMEs, the goal is not to build the noisiest possible monitoring estate. It is to create a manageable detection capability that helps a small team focus on the right events at the right time.
Practical starting point
If you want a simple way to begin, pick five to ten high-priority detections and review them using the same questions:
- What behaviour is this meant to catch?
- How many alerts did it generate last month?
- How many were useful?
- How long did triage take?
- What tuning or enrichment would improve it?
That exercise usually reveals a small number of detections that create most of the noise. Fixing those first often gives the best return on effort.
If you want help turning detection metrics into a practical improvement plan, a consultant can help you assess your current telemetry, tune noisy rules, and align detection priorities with business risk.
Comments are closed