
Identifying bottlenecks and single points of failure in security architecture
When teams talk about security architecture, the discussion often starts with controls such as MFA, encryption, logging, and segmentation. Those are important, but they do not tell the whole story. A system can be well protected and still be fragile if one service, one network path, one supplier, or one person becomes a bottleneck or a single point of failure.
For UK SMEs, this matters because fragility is not only an availability problem. A weak dependency can also become a security problem. If identity services fail, users may be locked out of critical systems. If a message broker stalls, security events may stop flowing into the SIEM. If a backup platform depends on the same credentials as production, recovery may fail when it is needed most. In practice, resilience and security are closely linked.
This article sets out a practical way to identify bottlenecks and single points of failure, prove where the risk sits, and turn the findings into an improvement backlog. The aim is not perfect redundancy everywhere. The aim is to understand where failure would hurt the business most, then design proportionate resilience into the architecture.
Why bottlenecks and single points of failure matter in security architecture
How availability issues become security issues
A bottleneck is a component that limits throughput or causes delay under load. A single point of failure is a component whose failure can stop a service or make recovery significantly harder. The two often overlap, but they are not the same thing.
From a security perspective, bottlenecks can create exploitable conditions. For example, a central authentication service may work well under normal load, but if it becomes saturated during a phishing campaign or password spray event, legitimate users may be unable to sign in. That can disrupt incident response, business operations, and recovery. Similarly, if logging depends on a single collector or forwarding path, an attacker does not need to break the logging platform to reduce visibility. They only need to overload or interrupt the path that feeds it.
Availability failures also affect control effectiveness. Access reviews, alert triage, backup verification, and patch deployment all depend on underlying services. If those services are fragile, the organisation may believe it has a control in place when, in reality, the control is unreliable under stress.
Where SMEs typically inherit hidden fragility
SMEs often inherit fragility through growth rather than design. A system starts small, then a shared service becomes the default dependency for everything. Common examples include:
- One identity provider for all internal and external access.
- One VPN concentrator for all remote administration and user access.
- One DNS service for internal and internet-facing workloads.
- One message queue or integration bus for multiple business processes.
- One storage platform for production, backups, and archives.
- One administrator with unique knowledge of the recovery process.
These patterns are not inherently wrong. Centralisation can improve manageability and reduce cost. The issue is when centralisation is not matched with resilience, monitoring, and recovery planning.
Define the system boundaries before you look for weak points
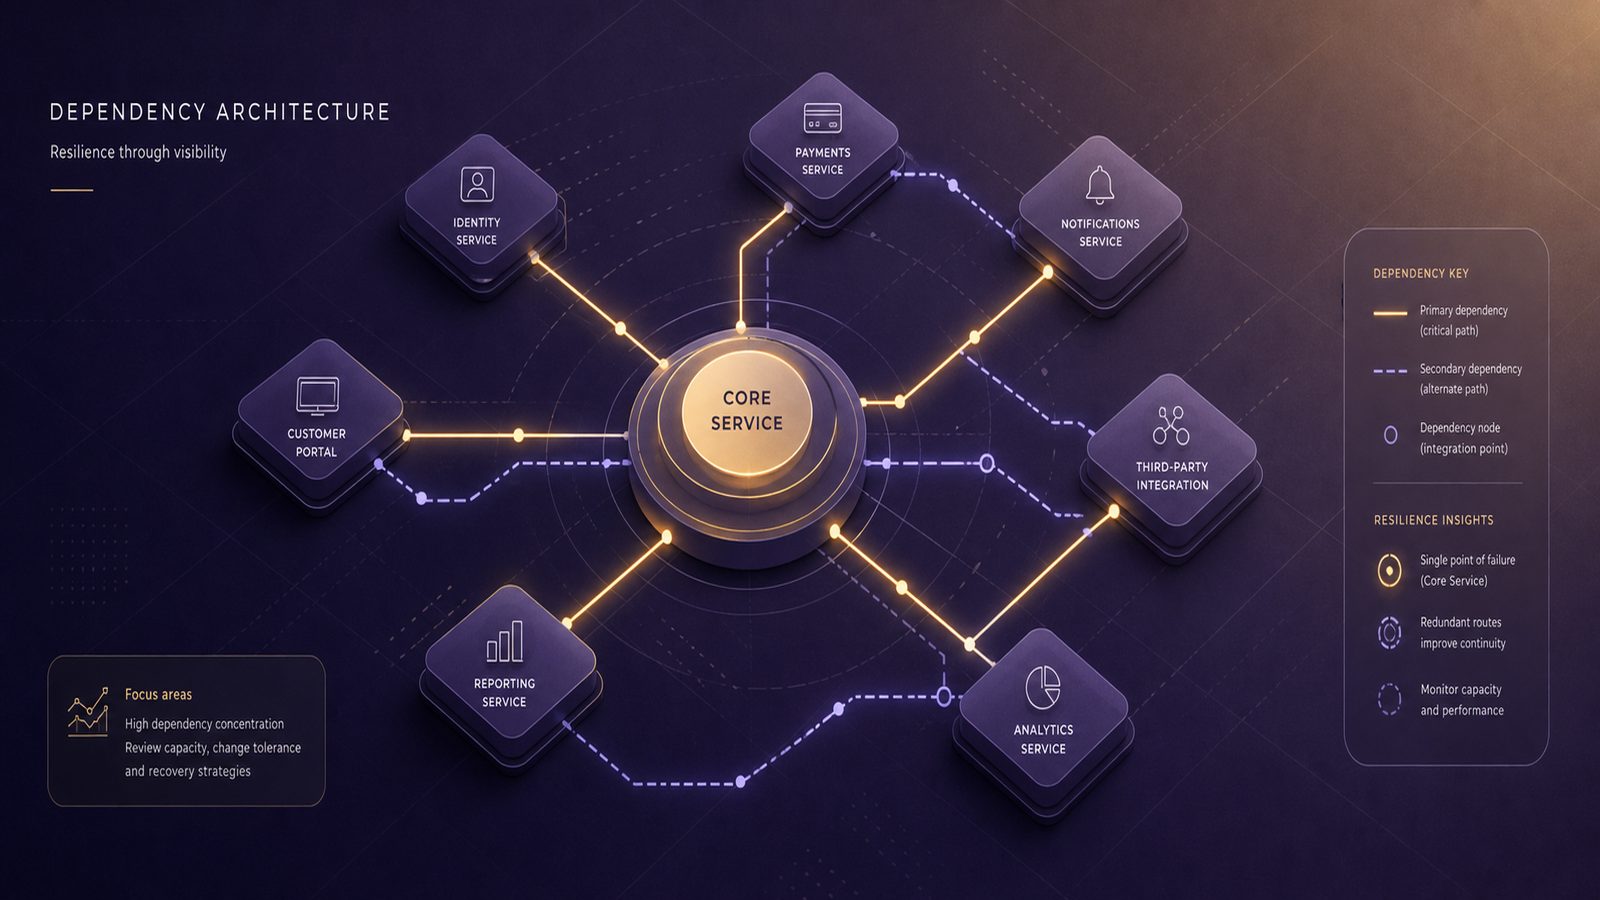
You cannot identify bottlenecks properly until you know what is in scope. Many teams focus on the application and miss the supporting services that make it work. A useful starting point is a simple data-flow diagram. This does not need to be elaborate. It should show the main components, the trust boundaries, and the dependencies between them.
Use data-flow diagrams to map trust boundaries and dependencies
For each important service, map:
- Users and client devices.
- Application tiers.
- Identity providers and directories.
- Databases and storage.
- Network controls such as firewalls, proxies, and VPNs.
- Logging, monitoring, and alerting paths.
- Backup, restore, and disaster recovery dependencies.
- External suppliers and APIs.
Then mark where trust changes. For example, traffic may move from the public internet to a reverse proxy, then to an application tier, then to a database. Each boundary is a place where failure, misconfiguration, or overload can affect the whole service.
In threat modelling terms, this is where STRIDE can help. You are not only looking for spoofing, tampering, or denial of service in the classic sense. You are also asking where the architecture concentrates risk. A component that sits on every path deserves more scrutiny than one that supports a single low-value workflow.
Separate application, identity, network, and operational dependencies
One common mistake is to treat the application as the system. In reality, the application may depend on several layers:
- Application logic and code.
- Identity and access management, including RBAC and conditional access.
- Network routing, DNS, TLS termination, and load balancing.
- Storage and database availability.
- Operational tooling such as CI/CD, secrets management, and monitoring.
When these layers are separated in the analysis, hidden dependencies become easier to see. For example, an application may appear highly available because it runs in two availability zones, but if both zones authenticate through the same directory service in the same region, the real resilience is lower than it first appears.
Identify common bottleneck patterns
Centralised identity, DNS, VPN, and message broker dependencies
Identity is one of the most common choke points. If all access depends on a single identity provider, then any outage, misconfiguration, or capacity issue can affect the whole estate. This is especially important where identity is used for both workforce access and service-to-service authentication.
DNS is another frequent bottleneck. Many teams only notice DNS when it fails completely, but partial failure can be just as disruptive. Slow resolution, stale records, or a single resolver path can create intermittent application issues that are hard to diagnose. In security operations, this can also affect telemetry, certificate validation, and access to cloud services.
VPNs and remote access gateways are often overused. If all remote administration, supplier access, and user connectivity depend on the same gateway, it becomes both a bottleneck and a high-value target. The same applies to message brokers and integration platforms. They are useful for decoupling systems, but if every workflow depends on one broker cluster without proper capacity and failover design, the architecture becomes brittle.
Shared databases, storage tiers, and API gateways as choke points
Shared databases can create both performance and resilience issues. A database that serves multiple applications may become the limiting factor long before the application tier is saturated. If one workload generates expensive queries, it can affect every other workload on the same platform.
Storage tiers can also become hidden choke points. This is common where production data, logs, snapshots, and backups all land on the same platform. If the storage service slows down or fills up, the impact can spread quickly across the environment.
API gateways and reverse proxies deserve similar attention. They are often introduced to simplify exposure control, authentication, and rate limiting. That is sensible, but the gateway itself becomes a critical dependency. If it is not horizontally scalable, not monitored properly, or not deployed with failover in mind, it can become the point where all traffic queues up.
Spot single points of failure in infrastructure and operations
Compute, storage, and network path failures
Infrastructure single points of failure are usually easier to spot than operational ones, but they are still missed in practice. Look for:
- One virtual machine hosting a critical service with no standby.
- One cluster node carrying a disproportionate share of traffic.
- One firewall pair with asymmetric routing or a fragile failover design.
- One internet circuit or cloud region supporting a critical workload.
- One storage array or one backup repository with no tested restore alternative.
In cloud environments, the presence of multiple instances does not automatically mean resilience. If those instances share the same failure domain, the same identity plane, or the same storage backend, the architecture may still have a single point of failure. The same principle applies on-premises. Two servers in the same rack are not independent if the rack power, switch, or storage path is shared.
People, process, and supplier dependencies that create hidden fragility
Operational dependencies are often the most overlooked. A system may be technically redundant but still fragile if only one person knows how to restore it, approve changes, or rotate a critical secret. That is a single point of failure in the operating model.
Supplier dependencies matter too. If a managed service provider, SaaS platform, or telecoms supplier is responsible for a critical function, then your resilience depends on their availability, support model, and escalation path. This is not a reason to avoid suppliers. It is a reason to understand where the dependency sits and what happens if it degrades.
Ask practical questions such as:
- Who can restore the service if the primary administrator is unavailable?
- What happens if the supplier portal is down during an incident?
- Can the business operate in a reduced mode if a third-party API fails?
- Are there manual workarounds for critical processes?
Use practical analysis techniques to prove the risk
Failure mode and effects analysis for prioritising weak points
Failure mode and effects analysis, or FMEA, is a structured way to assess what can fail, how it fails, and what the impact would be. For each component or dependency, record:
- Failure mode.
- Likely cause.
- Operational impact.
- Security impact.
- Detection method.
- Existing controls.
- Recovery time.
Score the items using a simple scale for likelihood and impact. The goal is not mathematical precision. The goal is to compare dependencies consistently so the team can focus on the most material risks first.
For example, a single identity provider outage may score high because it affects access across the business. A low-value internal reporting tool may score lower even if it is annoying when unavailable. This keeps the work aligned to business impact rather than technical elegance.
Capacity review, dependency mapping, and blast-radius analysis
Capacity review tells you where a system is close to saturation. Look at CPU, memory, disk IOPS, queue depth, connection counts, thread pools, and request latency. If a service is already running hot during normal business hours, it has little headroom for incident conditions.
Dependency mapping shows what each service needs to function. Blast-radius analysis shows how far the impact spreads if one component fails. Together, they answer three useful questions:
- What fails first?
- What else is affected next?
- How much of the business is exposed?
In larger environments, this can be supported by service maps from observability tooling, CMDB data, cloud dependency graphs, and network flow logs. In smaller environments, a spreadsheet and a whiteboard may be enough, provided the information is kept current.
Measure resilience with the right evidence
Architecture decisions should be backed by evidence, not assumptions. The most useful evidence usually comes from a mix of metrics, logs, traces, and synthetic checks.
Availability metrics, saturation signals, and service-level indicators
Track service-level indicators that reflect user experience and control effectiveness. Examples include:
- Authentication success rate.
- API latency at the gateway and application tier.
- Queue depth and message age.
- Database connection pool exhaustion.
- Backup job duration and restore success rate.
- Log ingestion delay into the SIEM.
These indicators help you see where contention starts before a full outage occurs. A service may still be technically up while already failing from a business perspective. For example, a login service with a 30 second response time is effectively unavailable for many users.
Logs, traces, and synthetic checks to confirm where contention starts
Logs and traces are useful when they show the path through the system. Distributed tracing can reveal whether the delay is in the gateway, the application, the database, or an external API. Synthetic checks are equally valuable because they test the service from the outside, in the same way a user or monitoring agent would.
For security teams, this evidence also supports incident analysis. If alerting stops because a collector is overloaded, the logs should show when the queue backed up and which upstream service caused the pressure. That makes it easier to distinguish a genuine attack from an architectural weakness.
Reduce bottlenecks without creating new complexity
Redundancy, graceful degradation, and queue-based decoupling
The usual response to a bottleneck is to add redundancy, but redundancy should be targeted. Not every component needs active-active design. In many SMEs, a better first step is to remove unnecessary coupling and add graceful degradation.
Examples include:
- Using multiple identity paths for break-glass access.
- Separating production and backup storage.
- Introducing queues to absorb bursts rather than forcing synchronous calls.
- Allowing read-only access when write services are degraded.
- Using local caching for non-sensitive data where appropriate.
Queue-based decoupling is particularly useful because it smooths spikes and reduces direct dependency between services. The trade-off is that queues need monitoring, retention management, and clear failure handling. If they are ignored, they simply move the bottleneck elsewhere.
Avoiding over-engineering while improving resilience
SMEs do not need enterprise-scale complexity to improve resilience. In fact, over-engineering can create new failure modes. The right question is not, “Can we make this perfectly redundant?” It is, “What level of resilience is proportionate to the business impact if this fails?”
That usually leads to a small number of sensible patterns:
- Remove unnecessary centralisation.
- Add capacity headroom where saturation is likely.
- Introduce a second path for critical recovery actions.
- Document manual workarounds for essential processes.
- Test the design under realistic failure conditions.
Validate the design under load and failure conditions
Stress, failover, and recovery testing approaches for SMEs
Testing is where assumptions are either confirmed or disproved. A practical test plan might include:
- Load testing to see where latency and error rates begin to rise.
- Failover testing for critical services, including identity, DNS, and storage.
- Recovery testing for backup restore, not just backup completion.
- Dependency failure testing, such as disabling a non-production upstream service.
- Tabletop exercises for operational dependencies and supplier outages.
Keep tests controlled and proportionate. The purpose is to understand behaviour, not to cause avoidable disruption. Record the expected outcome, the actual outcome, and any unexpected side effects.
What to record so findings can feed architecture and risk decisions
Each test should produce evidence that can be used in architecture review and risk treatment. Capture:
- What was tested.
- Which dependency failed or was stressed.
- How long the service remained degraded.
- What users or systems were affected.
- What monitoring detected the issue.
- What recovery steps were required.
- What design change is recommended.
This creates a useful feedback loop between operations, architecture, and risk management. It also supports a more realistic view of resilience than a simple checklist ever could.
Turn findings into an architecture improvement backlog
Once the analysis is complete, convert the findings into a backlog that is prioritised by business impact and likelihood of failure. A useful rule is to start with dependencies that affect identity, recovery, visibility, and customer-facing services. Those are usually the areas where a failure has the widest blast radius.
Link each action to an outcome. For example:
- Reduce a central identity dependency to improve access resilience.
- Separate backup infrastructure from production to improve recoverability.
- Add monitoring to a queue or gateway to detect saturation earlier.
- Document break-glass procedures to reduce operational single points of failure.
If you use frameworks such as NIST CSF, map the work to Identify, Protect, Detect, Respond, and Recover. If you are working within an ISMS, keep the architecture findings tied to risk treatment and continual improvement. That makes the work easier to govern and easier to justify.
For technical teams, the most important habit is to treat dependency mapping as a living artefact. Systems change. Suppliers change. Authentication flows change. A diagram that is not maintained quickly becomes a source of false confidence.
Identifying bottlenecks and single points of failure is not a one-off exercise. It is part of keeping the architecture honest. The more clearly you understand where the system concentrates risk, the better you can design for resilience without adding unnecessary complexity.
If you would like help reviewing your architecture, dependency map, or resilience priorities, speak to a consultant.
Frequently asked questions
What is the difference between a bottleneck and a single point of failure?
A bottleneck limits performance or throughput, usually under load. A single point of failure is a component whose failure can stop a service or make recovery much harder. A component can be both, but not always. For example, a database may be a bottleneck during peak use and also a single point of failure if there is no tested failover path.
How do I find hidden dependencies in a small environment without specialised tooling?
Start with a simple service map. List the critical business services, then write down everything each one depends on, including identity, DNS, network paths, backups, monitoring, and suppliers. Validate the map with the people who run the systems, then test the most important assumptions through controlled failover or recovery exercises. In a small environment, a well-maintained spreadsheet is often enough to reveal the biggest risks.
Comments are closed